
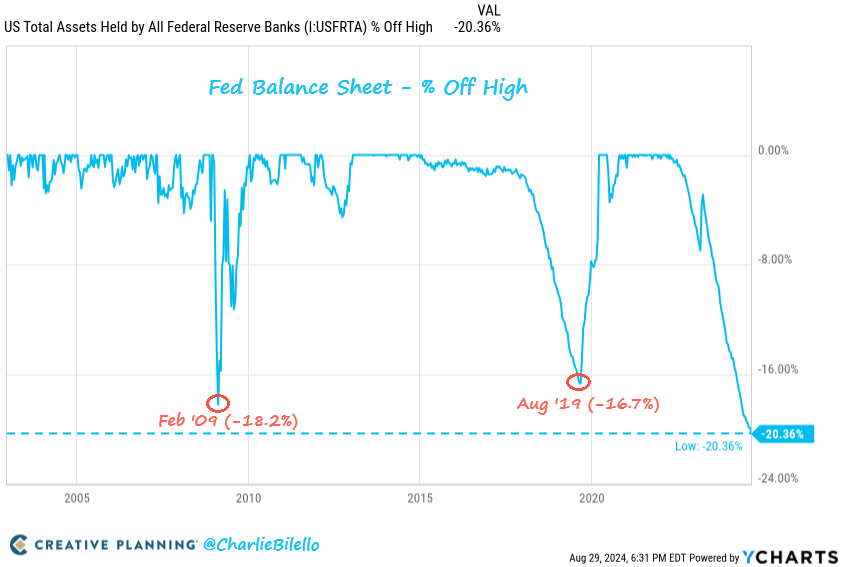
(Mike Maharrey, Money Metals News Service) I ran across a post on X by financial planner Charlie Bilello about the trajectory of the Federal Reserve balance sheet. It pointed out that the balance sheet is 20 percent below its April 2022 peak, “the largest drawdown on record.”
This struck me as a very odd flex, given the context of that drawdown.
To be fair, Bilello didn’t offer any commentary on balance sheet reduction, but I felt like I was supposed to be impressed by the Fed’s efforts.
I’m not.
Why Does the Balance Sheet Matter?
The Federal Reserve’s balance sheet is an important monetary policy tool. The mainstream tends to focus on interest rate policy, but the balance sheet may have an even bigger impact on the money supply and inflation than interest rate manipulation.
The balance sheet serves as the mechanism for quantitative easing (QE).
Artificially low interest rates drive money supply growth through the expansion of credit. Low rates incentivize borrowing and “stimulate” the economy. Because we have a fractional reserve banking system, banks can loan more money than they have. This results in money supply growth. (By definition inflation.)
Through QE operations, the balance sheet serves as a direct pipeline to the money supply. When the Fed buys assets – primarily U.S. Treasuries and mortgage-backed securities – it does so with money created out of thin air. Those assets increase the balance sheet and the new money gets injected into the economy. QE can boost the money supply with the accompanying inflationary pressures much more quickly than interest rate policy alone.
The Fed didn’t use the balance sheet as a policy tool to any great extent before the 2008 financial crisis. But when the Fed slashed rates to zero and it became clear that the scope of the crises went far beyond the central bank’s ability to control, Ben Bernanke turned to quantitative easing for the first time.
In effect, the Federal Reserve aggressively monetized U.S. debt. In practice, it bought Treasury notes and bonds on the open market with newly “printed” money. This created an artificial demand for U.S. debt, allowing the federal government to borrow more money than it otherwise could have. These bonds became assets on the Fed balance sheet.
At the time, Bernanke emphatically framed QE as an emergency measure. He told Congress that the central bank was not monetizing the debt and was not providing a permanent source of financing for the government. He said the Treasuries would only remain on the Fed’s balance sheet temporarily. He assured Congress that once the crisis was over, the Federal Reserve would sell the bonds it bought during the emergency.
This never happened.
A Broader Look at the Fed Balance Sheet
When you frame the recent balance sheet drawdown (quantitative tightening or QT) in percentage terms as Bilello did in his chart, it creates the impression that the central bank took an aggressive policy stance against inflation. The implication seems to be that it was a bold move by the Fed that could have far-reaching effects.
But when you put balance sheet reduction in the context of balance sheet expansion, it looks more like Powell & Company just spit in the ocean.
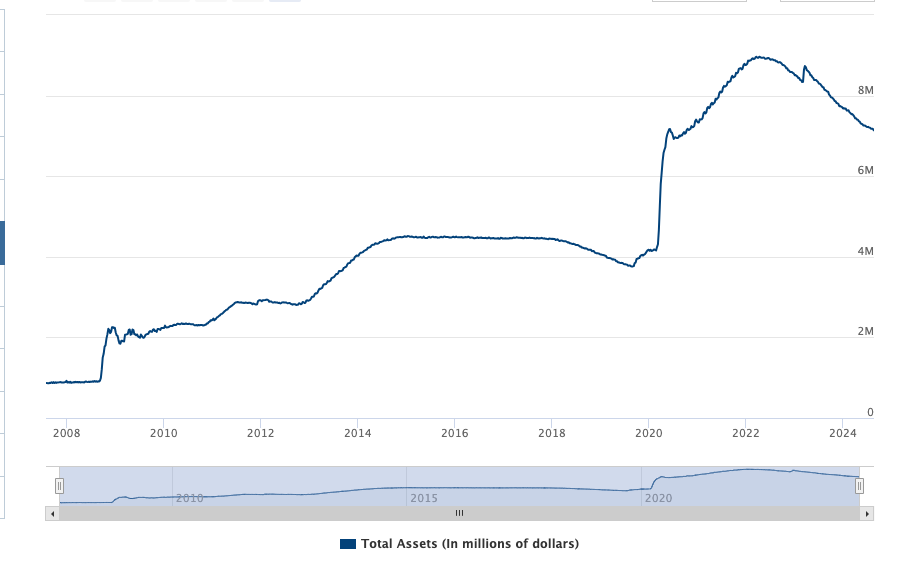
In 1996, the balance sheet stood at just under $500 billion. By August 2008, the Fed balance sheet was just under $910 billion. In 28 years, the balance sheet expanded at a slow steady pace in dollar terms as it kept pace with GDP growth. Through those years, the balance sheet stayed below 1 percent of GDP.
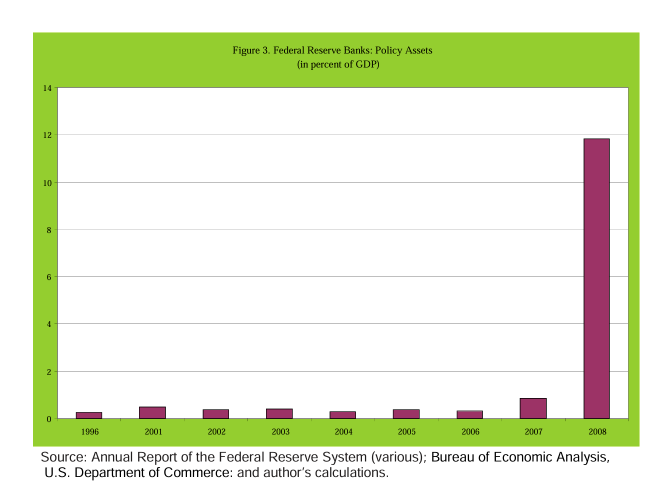
As the International Monetary Fund put it, “Evident in this Figure … is the extremely small FRB role in intermediating credit in the U.S. economy—until 2008.”
In the first round of QE in the wake of the financial crisis beginning in the fall of 2008, the Fed expanded the balance sheet to $2.25 trillion, nearly 12 percent of GDP. In percentage terms, the balance sheet grew by just over 147 percent.
And this was just round one.
There was a small drawdown in the first couple of months of 2009. It’s the first balance sheet reduction noted on Bilello’s chart at 18.25 percent.
But that was something of a feint. Bernanke ramped up the QE machine two more times during the Great Recession. At its peak in early 2015, the balance sheet stood at a staggering (at the time) $4.5 trillion. Between the fall of 2008 and January 2015, the balance sheet expanded by 394.5 percent.
In February 2011, Bernanke said, “Ultimately, at the right time, the Federal Reserve will normalize its balance sheet.”
If “normal” meant back to the pre-Great Recession level and under 1 percent of GDP, that time never came. (And it almost certainly never will.)
The central bank did finally initiate quantitative tightening in early 2018. In the spring, the Fed claimed that balance sheet reduction was “on autopilot.” That lasted about 18 months. When the stock market crashed in the fall of 2018 and the economy got shaky, the Fed panicked. By August 2019, when QT ended, the balance sheet was still at $3.76 trillion.
This is the second drawdown on Bilello’s chart coming in at 16.7 percent.
Remember, the Fed had expanded the balance sheet by nearly 400 percent. This wasn’t “normalization” in any sense of the word, Bernanke’s promises notwithstanding.
The Fed began expanding the balance sheet again even before the pandemic. By the time the pandemic got going, the balance sheet was only about $300 billion below the Great Recession peak.
Once governments started shutting down the economy, quantitative easing went into hyperdrive.
In February 2020 as COVID-19 gripped the world, the balance sheet stood at around $4.2 trillion – 20 percent of GDP. When it was all said and done, the balance sheet had ballooned to just under $9 trillion ($8.95 trillion). That was about 49 percent of GDP.
In the period between the onset of 2008 the financial crisis and the end of the pandemic, the Fed expanded the balance sheet by 889 percent.
The Fed announced its balance sheet reduction in March 2022 after conceding that price inflation wasn’t “transitory.” It wasn’t exactly ambitious. Given the parameters of the plan, it would take 7.8 years just to run off the amount added during the pandemic.
Of course, we’re nowhere near that. Since the pandemic peak, the central bank has run off about $1.76 trillion. As Bilello notes, this represents a 20 percent reduction – an all-time record. That sounds like a lot until you remember that it added almost $5 trillion in just under two years.
But the balance sheet still stands at just over $7.1 trillion — still 680 percent above the pre-2008 financial crisis level.
Now you understand why I’m not impressed.
By the way, in May, the Fed quietly announced that it would begin to taper balance sheet reduction. In other words, they’re about finished with the drawdown.
Maybe someday they’ll get around to fulfilling Bernanke’s promise – when it’s the “right time.”
My guess is that will be never.
Mike Maharrey is a journalist and market analyst for MoneyMetals.com with over a decade of experience in precious metals. He holds a BS in accounting from the University of Kentucky and a BA in journalism from the University of South Florida.